Urban Decarbonization
- Table of Contents
- Perception and Policies
- Targets and Progress
- System (Governance and Risk Management)
- Participation in Initiatives
- Climate-related Information Disclosure Based on the TCFD Recommendations
- Introduction of Renewable Energy
- Efforts for Regional Energy Network
- Collaboration with Tenants
- The Latest Initiative Case: Toranomon Hills Business Tower
- KPIs & Results
Perception and Policies
Perception
The shift in energy consumption due to the Industrial Revolution and increased economic activities, etc. have led to greater concentrations of greenhouse gas (GHG) in the atmosphere, including carbon dioxide (CO2), which is causing climate change. Climate change is gradually leading to extreme weather conditions, rising sea levels and other negative impacts on humans, animals, and plants. It also presents various risks for the Mori Building group's business activities. In response, Mori Building is committed to reducing energy consumption, greenhouse gas emissions, and decarbonizing its urban developments and related operations. Mori Building's social mission is to curb climate change, reduce business risks, and create a sustainable society that maintains the ecosystem for humans, animals, and plant life.
Policies
The Mori Building group is working to realize environmentally efficient cities by adopting energy-efficient systems in compact cities which vertically incorporates diverse urban functions. We will aim to decarbonize cities by conducting total and high-quality management. This includes introducing cutting-edge environmentally friendly technologies in new buildings, using the regional energy network, improving energy-saving systems when renewing existing buildings, collaborating with tenants on the operational side. Through these efforts, we will strengthen and continue the decarbonization initiatives.
Targets and Progress
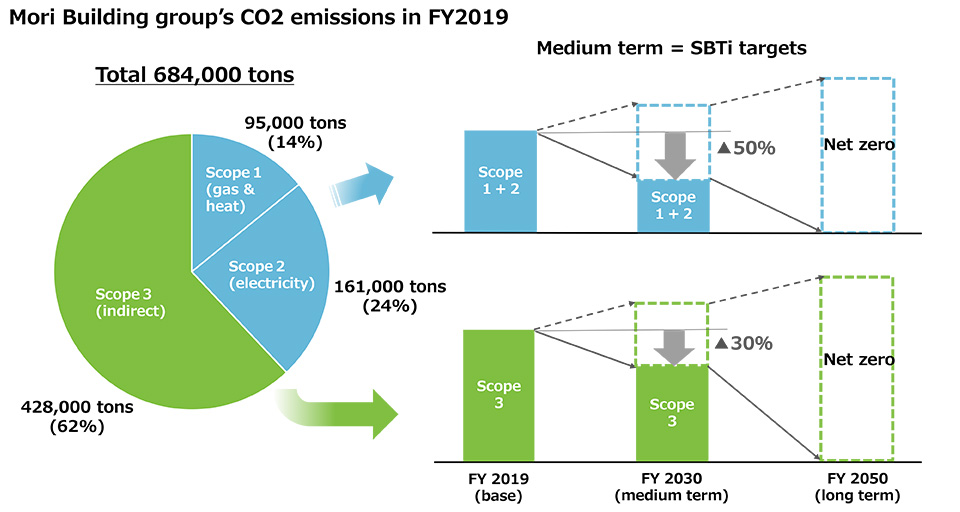
In May 2022, the Mori Building group established targets in accordance with the global standard of reducing GHG emission from our business activities by 50% in Scope 1*1 and Scope 2*2 in FY 2030 (compared to FY 2019), by 30% in Scope 3*3 (compared to FY 2019), net-zero by FY 2050, and proportion of renewable energy of 100% by FY 2030 in response to the decarbonization trend around the global and in Japan. We are also working toward the national effort targets (Act on the Rational Use of Energy) and existing energy efficient operation, aiming for the mandatory standards of the Tokyo Metropolitan Government (ordinance).
- Press release: Mori Building Fixes Greenhouse Gas Emission Medium & Long Term Targets Aims to Reach Net-Zero Emission by 2050 (2022-05-23)
Some figures have been revised after recalculation. Please note that the news release contains figures before the recalculation.
- 1 Scope 1: Direct emissions from sources that business owns or controls (Combustion of city gas and other fuels)
- 2 Scope 2: Indirect emissions from the use of electricity and heat supplied by other companies
- 3 Scope 3: Indirect emissions other than Scope 1 and Scope 2 (Emissions by other companies related to owned business activities)
System (Governance and Risk Management)
Governance
Mori building considers the promotion of sustainability-related initiatives is critical to our business execution. On this account, we have established the Sustainability Committee chaired by the President and CEO, and which comprises two separate subcommittees: the Environmental Promotion Committee and the Committee on Human Rights and Societal Issues.
The Sustainability Committee deliberates important matters regarding sustainability such as climate change, human rights, and supply chain management, in addition to supervising and monitoring the two subcommittees. The Board of Directors regularly receives reports from Sustainability Committee and evaluates critical issues.
The Environmental Promotion Committee, chaired by the director in charge of the Environmental Promotion Department, promotes and manages initiatives across the company regarding various environmental issues, including climate change, and reports to the Sustainability Committee on a regular basis.
The Sustainability Committee deliberates major issues such as drawing up policies dealing with risks and opportunities regarding climate change and establishment of targets for GHG emissions, while the Environmental Promotion Committee reports and discusses of these major issues and implements approved policies and plans (including the identification, evaluation and management of risks and opportunities).
Risk Management
The Mori Building group has organized the Risk Management Committee as a body that deliberates and approves of issues and measures for risk management across the group regarding climate change, both in overseas and Japan. In principle, the committee meets once a year to determine important policies and plan activities pertaining to the implementation of its systems, evaluate and analyze risk management, approve policies, monitoring measures, and planning.
Regarding individual risks, the supervisory organization and its authority and responsibilities are defined in accordance with risk management regulations, and heads of the relevant departments develop corresponding measures and instruction.
The Risk Management Committee Secretariat is established under the Risk Management Committee, implements monitoring of the Committee, supporting risk management activities of the supervisory organization for the individual risks.
Participation in Initiatives
Support Task Force on Climate-related Financial Disclosures (TCFD)
The Mori Building group makes recommendations to the Task Force on Climate-related Financial Disclosures (TCFD) which in turn recommends companies and other organizations to recognize climate change-related risks and opportunities, and incorporates them into their management strategies as well as disclose them.
Acquisition of SBTi Certification (Medium- to Long-Term Targets in Scope 1, 2 and 3)
The Mori Building group has quantitatively recognized and published the results of CO2 from Mori Building-owned real estate. In 2022, the group established the targets of reducing CO2 by 50% in Scope 1 + 2, and by 30% in Scope 3 by FY 2030 (compared to FY 2019). These targets are in line with the Paris Agreement*1, and were certified by the SBT initiative*2 in 2022 as science-based targets at the 1.5°C level.
- 1 Paris Agreement: International framework adopted at COP 21 in 2015 with the goal of limiting global warming to well below 2°C, preferably to 1.5°C, compared to pre-industrial levels
- 2 Science Based Targets initiative: International initiative in collaboration with the United Nations Global Compact (UNGC), the World Wildlife Fund (WWF), CDP, and the World Resources Institute (WRI)
Periodic Reporting to CDP (Scopes 1, 2 and 3)
In implementing the SBT initiative, we have tallied CO2 emissions from all real estate Mori Building group owned and managed. Going forward, we will tally the quantitative CO2 emissions annually and publish the data on our website as well as report it to CDP.
We received an A- score (level of leadership in climate-change actions) within the Climate Change category in 2022.
RE100 Membership
The Mori Building group is a member of RE100, a global initiative of companies that aim to procure 100% of the electricity used in their business activities from renewable energy. Our goal is to achieve this by 2030.
JCLP Membership
The Mori Building group is a member of the Japan Climate Leaders' Partnership (JCLP), a coalition of Japanese companies and organizations aiming to achieve the 1.5°C target by promptly transitioning to a decarbonized society to avert a climate crisis.
Climate-related Information Disclosure Based on the TCFD Recommendations
Strategy
Scenario Analysis
We are in the process of conducting a scenario analysis to understand the future risks and opportunities posed to our company by extreme weather due to climate change and the growing societal demand for measurers against climate change, as well as to verify the effectiveness of current climate-change measures and use the results to formulate future strategies as required. We identified key risk and opportunity areas that are likely to be highly relevant to our business and conducted an impact analysis. The analysis is based on multiple scenarios for the transition scenario (below 2°C) and the current scenario (4°C) to assess the financial impact of the risks and opportunities as they occur.
Analysis targets and prerequisites
- Area: Central Tokyo, where our company properties are located
- Scope: Entire supply chain
- Duration: From now until 2050
Major adaption scenarios
- below 2°C Scenario: IEA*1, SDS*2 (WEO*3 2020 and 2021) and IEA NZE*4 (WEO 2020 and 2021)
- 4°C Scenario: IPCC*5 RCP 8.5 (AR6 WG1 SPM*6), IEA STEPS*7 (IEA WEO 2020 and 2021)
- 1 IEA: International Energy Agency
- 2 SDS: Sustainable Development Scenario
- 3 WEO: World Energy Outlook
- 4 NZE: Net-Zero Emissions by 2050 Scenario
- 5 IPCC: Intergovernmental Panel on Climate Change
- 6 IPCC AR6 WG1 SPM: Sixth Assessment Report Working Group I Summary for Policymakers
- 7 STEPS: Stated Policy Scenario
Analysis procedure
- Identify factors that could have a significant impact on Mori Building's business by frequently discussing climate-related risks and opportunities TCFD sorted
- Based on the future predictions of the adoption scenarios, organize, and understand the situation under the below 2°C and 4°C scenarios for the risks and opportunities identified in (1)
- Calculate the financial impact on our business based on the future predictions of (2). Conduct qualitative analysis if quantitative calculation is difficult due to insufficient information
- Examine measures for the result of (3)
Risks, Opportunities and Financial Impact
Risks, Opportunities and Financial Impact
| Risks and opportunities | Financial impact | Degree of impact*1 | Duration of maximum impact*2 | Measures*3 | |||
|---|---|---|---|---|---|---|---|
| below 2°C | 4°C | ||||||
| Transition Risks | Laws and regulations | Tightening of energy-efficient building standards (ZEB, etc.) regulations | Increase in construction and repair costs corresponding ZEB, environmental building regulations, etc. | Minimum | ― | Mid- to long-term | 1 |
| Progress in carbon pricing (Carbon tax and an emissions trading system) | Increase in construction costs due to rising the price of raw materials with large emission intensity (Steel, cement, etc.) caused by introduction of a carbon tax | Small | ― | Mid- to long-term | 6 | ||
| Technologies | Development and diffusion of low-carbon technologies | Increase in capital investment by shifting to new technologies | Minimum | ― | Mid- to long-term | 1 | |
| Markets | Soaring price of renewable electricity | Increase in procurement costs for renewable electricity | Minimum | ― | Mid- to long-term | 4 | |
| Reputation | Increasing expectations from ESG investors regarding climate change measures | Declining investor confidence and withdrawing from investment due to insufficient and delays in measures against climate change (Difficulties in raising funds) | Minimum to Medium | ― | Mid- to long-term | 1 2 3 4 |
|
| Physical Risks | Acute | Intensification of natural disasters and extreme weather (Torrential rains, floods, typhoons, water shortages, etc.) | Loss of business opportunities due to torrential rains (Including flooding and sediment disasters) | ― | Minimum | Long-term | 5 |
| Opportunities | Products and service | Growing demand for properties with high environmental performance (Environmentally certified buildings, high-efficiency energy, etc.) | Increase in sales due to rising rents through upturn in the number of sustainability-oriented tenants, and a rise in asset value due to investor support | Small to Medium | ― | Mid- to long-term | 1 2 3 4 |
- 1 The degree of impact is calculated based on the financial impact and classified under minimum to maximum assessments
- 2 Short-term: Current to 2025, Medium-term: to 2030, Long-term: to 2050
- 3 Refer to the table below for countermeasures
Countermeasures Against Identified Risks and Opportunities
| Countermeasures | Overview | |
|---|---|---|
| 1 | Introduction of ZEB |
|
| 2 | Expression of corporate attitude |
|
| 3 | Low-carbonization facility operation |
|
| 4 | Achievement of targets of introducing renewable energy |
|
| 5 | Strengthening disaster prevention capabilities of properties |
|
| 6 | Improvement of environmental performance with newly built and existing buildings |
|
We will strive to strengthen resilience by maximizing opportunities and minimizing risks through introduction of renewable energy and implementation of early countermeasures to further lower carbonation and decarbonation going forward.
Introduction of Renewable Energy
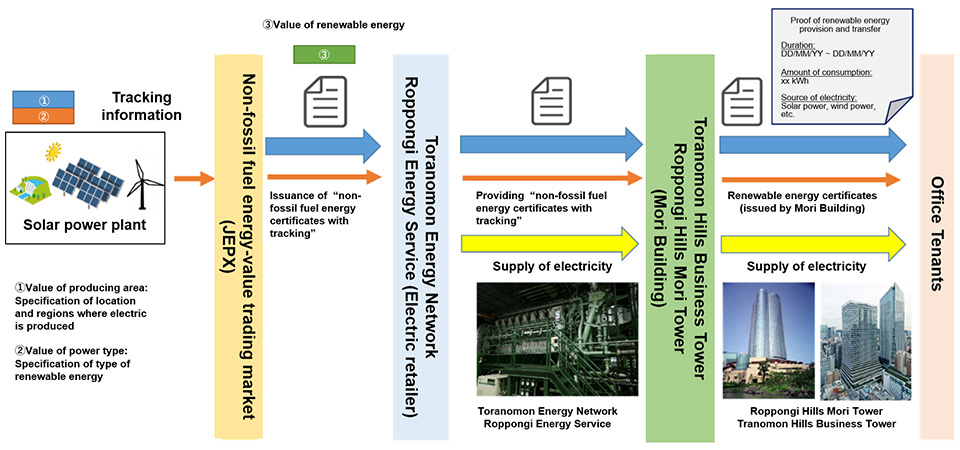
Introduction of Renewable Energy Electricity
With their own energy plant, Roppongi Hills Mori Tower and Toranomon Hills Business Tower have been supplying renewable energy electricity using non-fossil certificates to tenants who have requested it, the first case of its kind in Japan for an office leasing company. Currently, approximately 70% of the electricity used in domestic properties, mainly in Hills-class properties, is switched to fully renewable energy for the entire building (both tenant-exclusive areas and common areas).
Properties switched to fully renewable electricity (by FY2022)
- Roppongi Hills Mori Tower
- Roppongi Hills Gate Tower*
- Roppongi Hills North Tower
- Keyakizaka Complex
- Grand Hyatt Tokyo
- Toranomon Hills Mori Tower*
- Toranomon Hills Business Tower*
- SHINTORA-DORI CORE
- ARK Mori Building
- ARK Hills Sengokuyama Mori Tower*
- ARK Hills South Tower
- Atago Green Hills Mori Tower
- Holland Hills Mori Tower*
- Akasaka Tameike Tower*
- Koraku Mori Building
- For residences, only common areas since private areas (units) are contracted individually by residents
Stable Procurement of Renewable Energy Facilities
Given the need to secure a stable supply of renewable energy electricity in the future, we are considering various methods to procure energy from other renewable sources, such as solar- and wind-power producers, in collaboration and partnership with a wide range of businesses, including electric power companies and renewable energy developers.
Efforts for Regional Energy Network
In our urban developments, where energy density is high and a variety of uses are concentrated, we are simultaneously improving energy efficiency and energy security for disasters by networking energy on an area-wide level through the promotion of regional energy use.
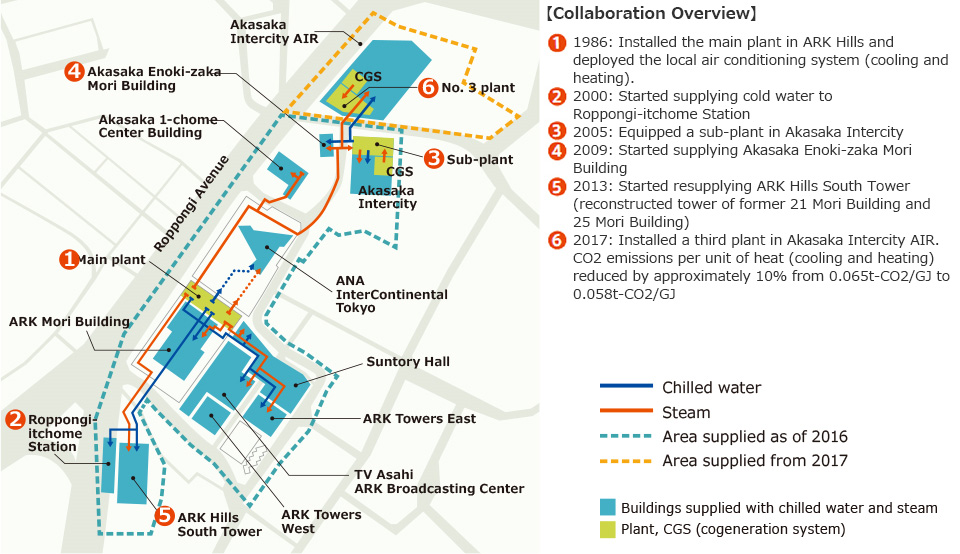
ARK Hills Heat Supply
In the vicinity of ARK Hills, beyond the area under Mori Building's management, we are continuously working to expand the energy network for heat supply in collaboration with neighboring developments, thereby further improving efficiency throughout the area.
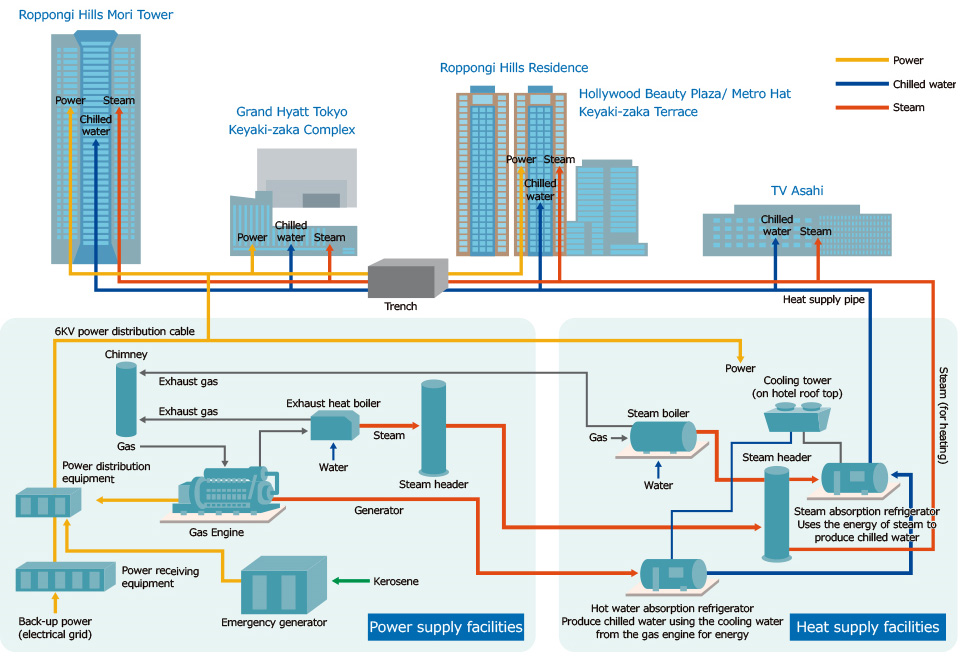
Roppongi Energy Service Co., Ltd.
Roppongi Hills leverages regional energy use from an energy center that is located in the basement of Roppongi Hills Mori Tower and operated by Roppongi Energy Service Co., Ltd. A large gas co-generation system produces electricity and its waste heat is used to generate steam, which is then used for heating and cooling. Roppongi Hills, with its diverse mix of energy uses, requires electricity and heat throughout the day, which helps to level out demand and improve energy efficiency. Between 2015 and 2017, the energy center implemented a full-scale replacement of its gas-turbine generators with gas-engine generators, mainly to meet the changing demands of more eco-conscious tenants as well as upgrade its equipment, resulting in high energy efficiency of about 76% at present.
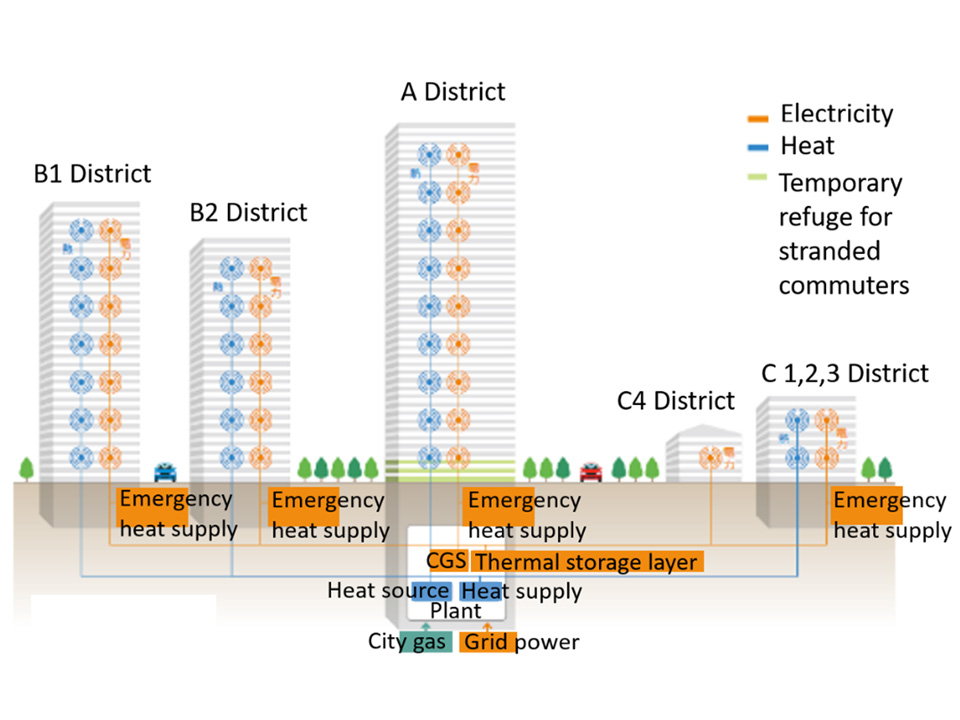
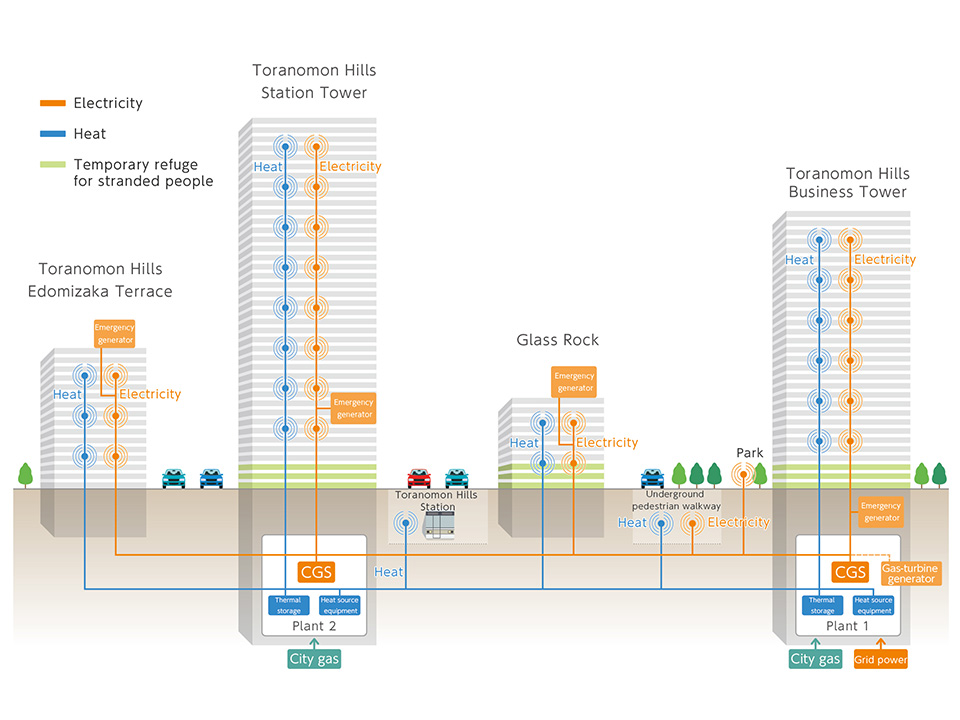
Toranomon Energy Network Co., Ltd.
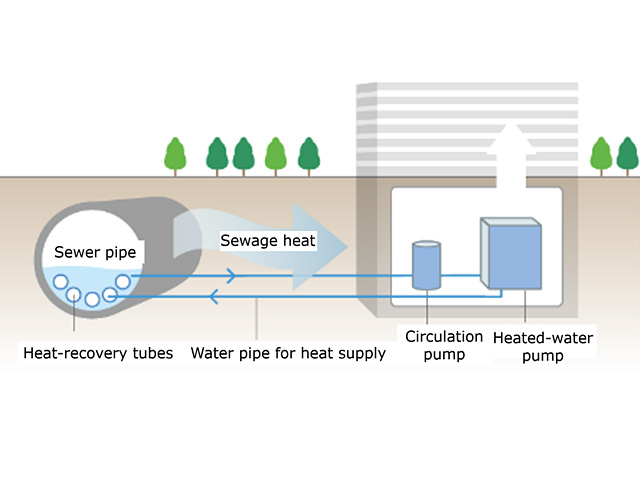
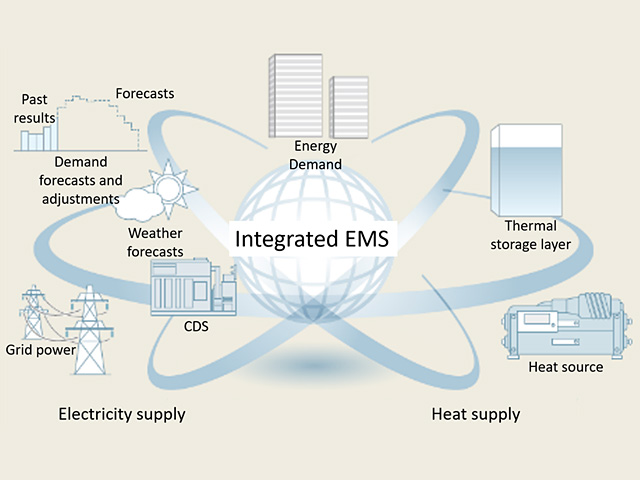
In the Azabudai Hills and Toranomon Hills area, a high-efficiency energy center run by Toranomon Energy Network Co., Ltd. has been established to implement regional energy supply to the cities. By integrating mixed-use buildings with different usage tendencies, such as offices, residences and hotels, in the Azabudai Hills and Toranomon Hills areas, energy can be leveled and appropriately controlled for improving energy efficiency. In addition, the energy center is equipped with AI for more efficient control and utilization of latent energy, such as sewage heat in the area.
Collaboration with Tenants
Global Warming Countermeasures Conference
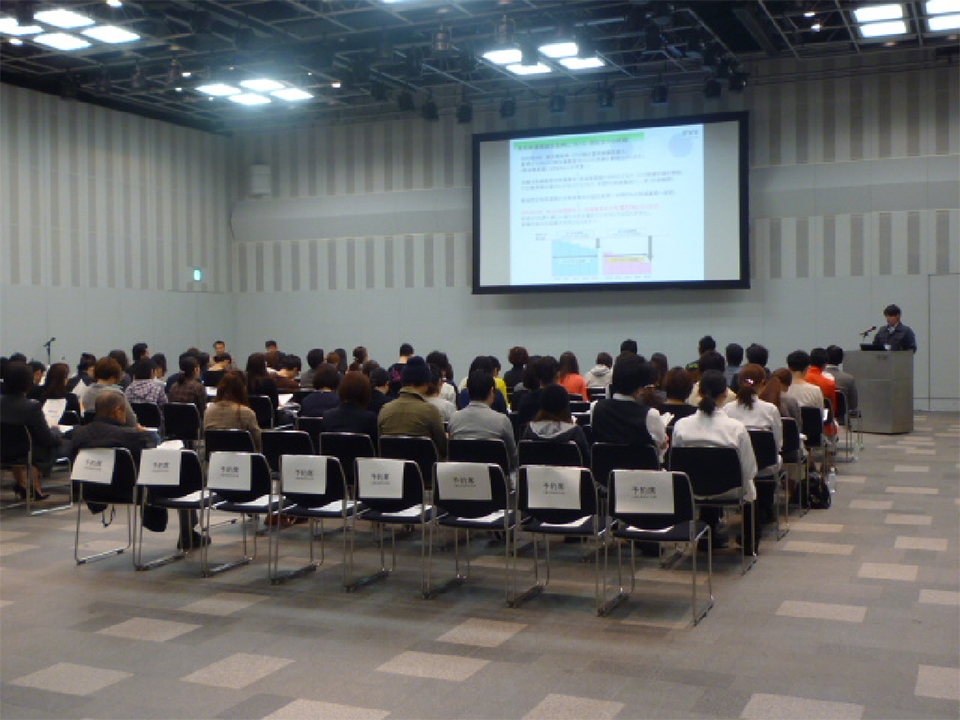
In general, 60% of an office building's energy consumption is allegedly used in tenant dedicated areas, of which 70% is used by tenants via lighting and electrical outlets directly. In order to conserve energy use from buildings, tenant's cooperation, and dialog with the tenants to gain their cooperation are essential. Accordingly, Mori Building holds a Global Warming Countermeasures Conference once a year at each of its buildings, for instance, to request the cooperation of tenants regarding energy conservation and to share energy-conservation case studies with them.
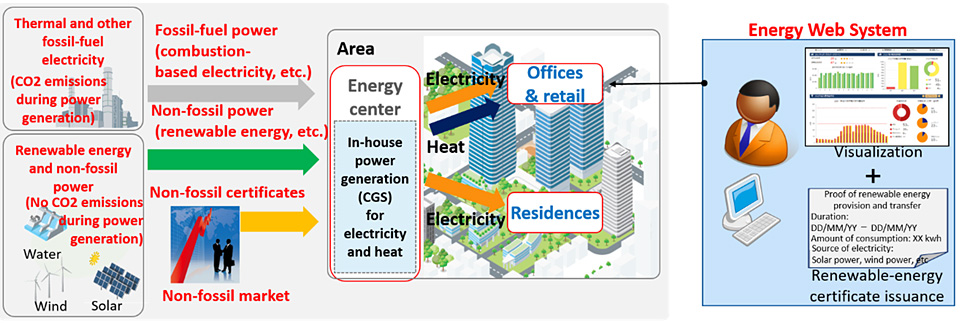
Tenant Energy Web System
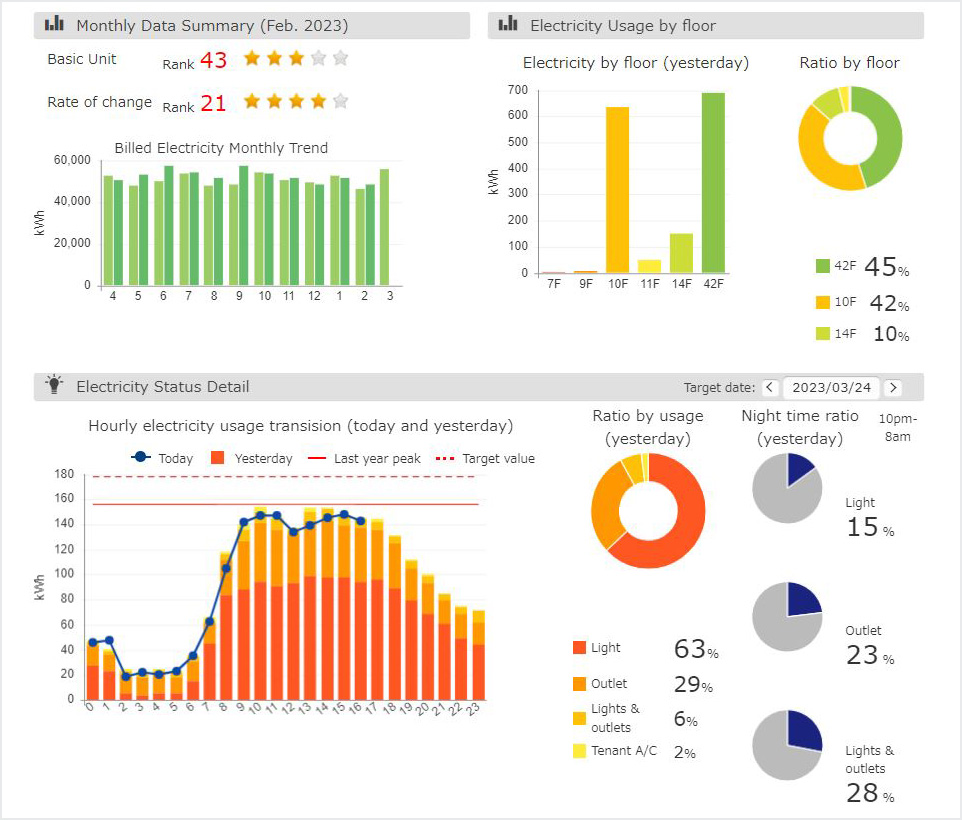
The Mori Building group has developed the Tenant Energy Web System to enable tenants to "visualize" their energy consumption. The system is an online service accessible to all tenants, allowing them to easily check their energy consumption trends and results of their energy-conservation efforts both numerically and graphically and thereby encourage them to adopt specific energy- and power-saving practices.
Dissemination of Environmental Information
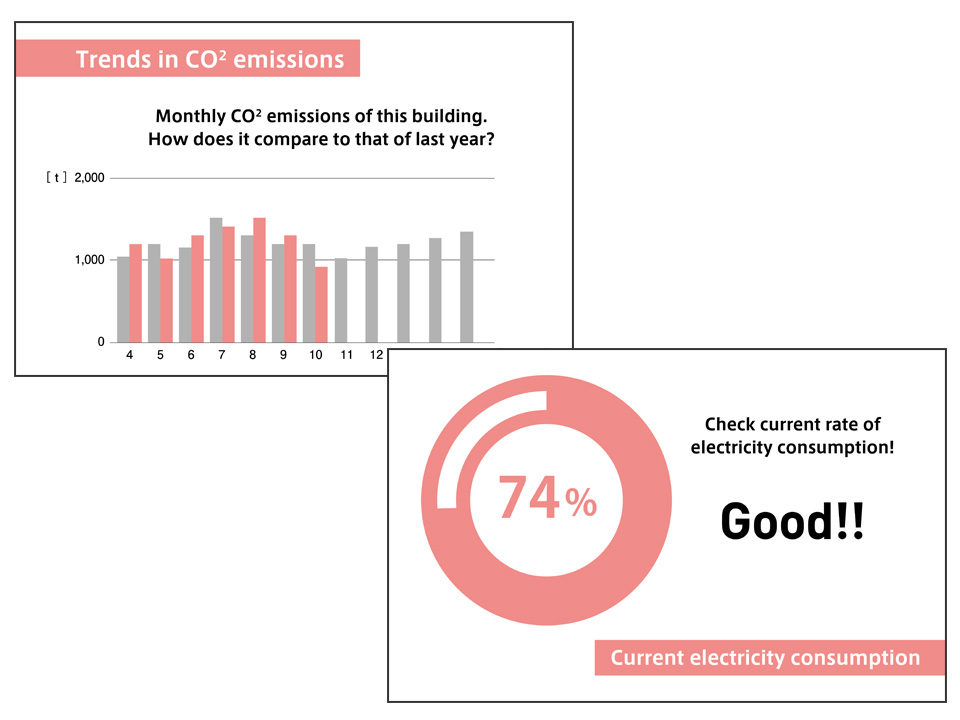
We are working to save energy and power along with our tenants by sharing the status of the building by publishing environmental information, such as CO2 emissions and hourly electricity consumption across the entire building on monitors in the city.
The Latest Initiative Case: Toranomon Hills Business Tower
CO2 Reduction through Supply/Demand Linking
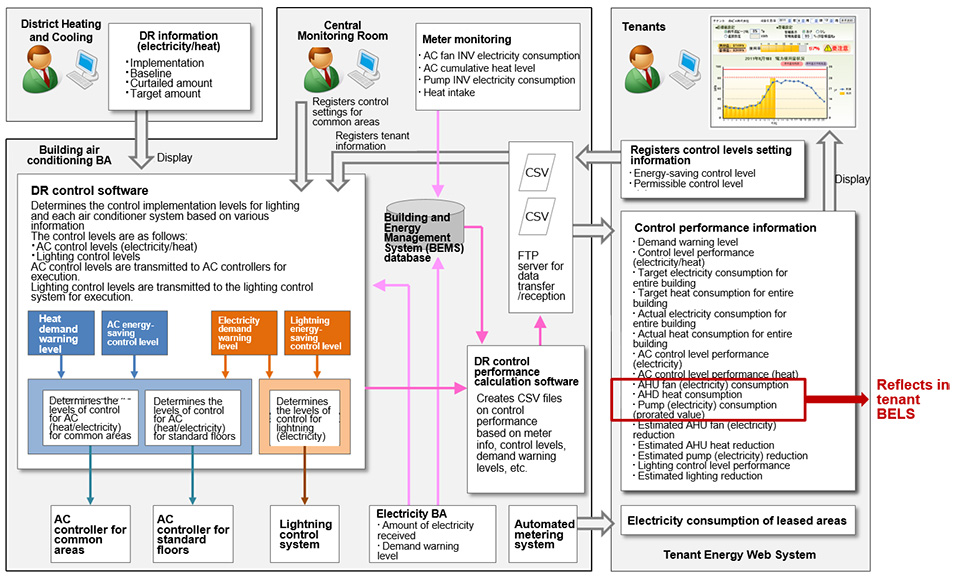
Mori Building has established a system that responds to the electricity and heat demands of a building, which links the control settings determined in advance by tenants to common area control in case area power is curtailed and automatically executes this setting. This helps to restrain the building's electricity and heat demands while simultaneously optimizing power delivery to the entire area supplied by the energy center. In addition, tenants are able to check the implementation status of their leased area via the Tenant Energy Web System.
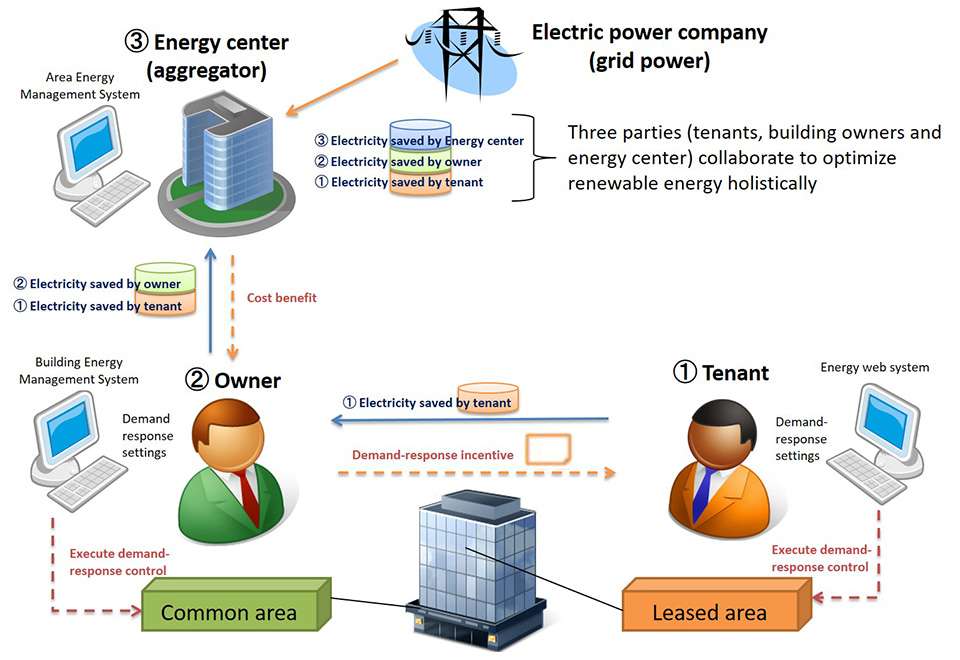
Tenant Demand-response
To implement advanced management of energy supply and demand, three parties—(1) the tenants, (2) the building owners and (3) the energy center—cooperate to execute demand-response control measures during peak periods of electricity and heat use and energy conservation control measures during normal times.
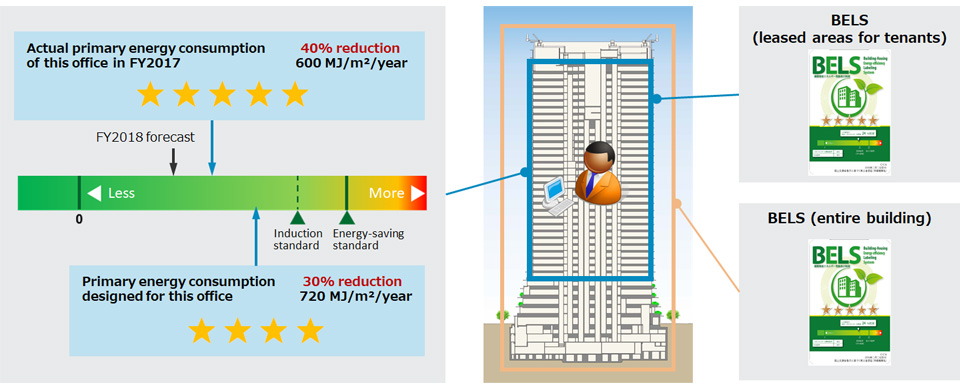
BELS Certification and Performance Disclosure
Mori Building also has obtained BELS certification for tenant dedicated areas. Comparing BELS values on building performance against the energy-consumption performance of individual tenants helps to raise their awareness of energy conservation.
KPIs & Results
Boundaries (Scope of Calculation)
Boundary 1: GHG Protocol Compliant and SBTi Certified
| FY2019 (Base year) |
FY2020 | FY2021 | ||
|---|---|---|---|---|
| Group companies | 20 | 22 | 22 | |
| Total floor area (m²) | 2,727,026 | 2,727,026 | 2,781,856 | |
| Applicable facilities | 74 | 74 | 75 | |
| Japan | Large complexes | 2 | 2 | 2 |
| Offices | 41 | 41 | 41 | |
| Retail facilities | 10 | 10 | 10 | |
| Hotel | 1 | 1 | 1 | |
| Residences | 14 | 14 | 15 | |
| Others | 4 | 4 | 4 | |
| Overseas | Complex | 1 | 1 | 1 |
| Office | 1 | 1 | 1 | |
- Applies to Mori Building and its consolidated subsidiaries
- Calculation method of facility is defined as one building by a power receiving point for energy-demand facilities
- Large complex is defined as a total floor area of 50,000m² or more and serves three or more functions
- Buildings with offices and residences are classified as offices and those with retail facilities and residences are classified as retail facilities
- Total floor area: total area of energy-consuming facilities (excluding exclusive residential areas)
Boundary 2: Act on the Rational Use of Energy (Reported by Mori Building)
| FY2019 | FY2020 | FY2021 | |
|---|---|---|---|
| Total floor area (m²) | 314,516 | 313,015 | 315,010 |
| Applicable buildings | 96 | 96 | 93 |
- Properties owned by Mori Building (condominium or co-owner areas are divided proportionally)
- The following buildings are reported as one building by each owner according to the Act on the Rational Use of Energy:
Roppongi Hills, ARK Mori Building, Toranomon Hills Mori Tower, Atago Green Hills Mori Tower, ARK Hills Sengokuyama Mori Tower, ARK Hills South Tower, Akasaka Tameike Tower, and Koraku Mori Building
Boundary 3: Tokyo Metropolitan Ordinance (Reported by Mori Building)
| FY2019 | FY2020 | FY2021 | |
|---|---|---|---|
| Total floor area (m²) | 300,789 | 320,949 | 342,178 |
| Applicable buildings | 34 | 32 | 32 |
- Properties and scope of Mori Building's reporting obligations
- The following buildings are reported as one building by each owner according to the Tokyo Metropolitan Ordinance for large-scale offices:
Roppongi Hills (Roppongi Hills Mori Tower, Grand Hyatt Tokyo, Keyakizaka Complex), ARK Mori Building, Toranomon Hills Mori Tower, Atago Green Hills Mori Tower, ARK Hills Sengokuyama Mori Tower, ARK Hills South Tower, Akasaka Tameike Tower, Koraku Mori Building, Omotesando Hills, Hollywood Beauty Plaza, Roppongi First Building, Palette Town West Mall
Greenhouse Gas Emissions (GHG Protocol Compliant & SBTi Certified); KPIs and Results
Greenhouse Gas Emissions (Scopes 1, 2 and 3) Unit: t-CO2
| Scope | Target | FY2019 | FY2020 | FY2021 |
|---|---|---|---|---|
| Scope1 |
|
95,167 | 87,495 -8.1% |
98,369 +3.4% |
| Scope2 | 160,816 ― |
150,538 -6.4% |
121,437 -24.5% |
|
| Scope3 | 427,598 | ― | 484,620 +13.3% |
- Applies to Boundary 1
Greenhouse Gas Emissions (Scope 3 Breakdown)
| Scope 3 categories | FY2019 | FY2020 | FY2021 |
|---|---|---|---|
| 1. Manufacture and service of purchased products | 141,826 | ― | 81,613 |
| 2. Capital goods | 212,183 | ― | 231,801 |
| 3. Fuel and energy-related activities (not included in Scopes 1 and 2) |
41,344 | ― | 42,070 |
| 4. Transportation and distribution (upstream) | 12,150 | ― | 464 |
| 5. Waste generated by business operations | 8,835 | ― | 6,351 |
| 6. Business trips | 471 | ― | 506 |
| 7. Employee commuting | 1,025 | ― | 904 |
| 8. Leased assets (upstream) | ― | ― | ― |
| 9. Transportation and distribution (downstream) | ― | ― | ― |
| 10. Processing of sold products | ― | ― | ― |
| 11. Use of sold products | 4,505 | ― | 120,911 |
| 12. Disposal of sold products | 180 | ― | ― |
| 13. Leased assets (downstream) | 5,080 | ― | ― |
| 14. Franchises | ― | ― | ― |
| 15. Investments | ― | ― | ― |
| Total | 427,598 | ― | 484,620 |
- Applies to Boundary 1
Breakdown of GHG Types in Scope 1 (FY2019)
| GHG types | FY2019 | FY2020 | FY2021 | |||
|---|---|---|---|---|---|---|
| Emissions | % | Emissions | % | Emissions | % | |
| Greenhouse gas emissions (Scope 1) | 95,167 | 100% | 84,405 | 100% | 94,248 | 100% |
| CO2: Carbon dioxide | 95,167 | 100% | 84,405 | 100% | 93,984 | 99.7% |
| CH4: Methane | 0 | 0% | 0 | 0% | 0 | 0% |
| N2O: Nitrous oxide | 0 | 0% | 0 | 0% | 0 | 0% |
| HFCs: Hydrofluorocarbons | 0 | 0% | 0 | 0% | 265 | 0.3% |
| PFCs: Perfluorocarbons | 0 | 0% | 0 | 0% | 0 | 0% |
| SF6: Sulfur hexafluoride | 0 | 0% | 0 | 0% | 0 | 0% |
| Others | 0 | 0% | 0 | 0% | 0 | 0% |
- Applies to Boundary 1
Third-party Independent Verification
The Mori Building group has obtained assurance from LRQA Limited that specific environment-related data are guaranteed.
Renewable Electricity: KPIs and Results
RE100 Progress
| Scope | Target | FY2019 | FY2020 | FY2021 | FY2030 (Target) |
|---|---|---|---|---|---|
| Electricity consumption (MWh) | 100% by FY2030 | 391,259 | 371,537 | 378,781 | ― |
| Amount of renewable electricity (MWh) | 5,049 | 7,497 | 9,114 | ― | |
| Renewable energy consumption rate | 1.3% | 2.0% | 2.4% | 100% |
- Applies to Boundary 1. Figures are electricity and renewable energy consumption for demand buildings
Primary Energy Consumption (Act on the Rational Use of Energy, Reported by Mori Building): KPIs & Actuals
| Scope | Target | FY2019 | FY2020 | FY2021 |
|---|---|---|---|---|
| Energy consumption (kL) | ― | 11,651 | 10,271 | 10,229 |
| Energy consumption rate (kL/m²) | 1% reduction/year | 0.03070 | 0.32813 | 0.03247 |
| Year-on-year reduction rate (%) | ― | ― | -6.87 | 1.04 |
- Applies to Boundary 2
Greenhouse Gas Emissions (Tokyo Metropolitan Ordinance on Environmental Preservation, Reported by Mori Building): KPIs and Results
| Scope | Target | FY2019 | FY2020 | FY2021 |
|---|---|---|---|---|
| CO2 intensity (kg CO2/m²) | ― | 79.09 | 67.30 | 69.57 |
| Year-on-year reduction (%) | ― | 3.2 | 16.4 | -2.72 |
- Applies to Boundary 3
- Please see "Reporting System based on the Act on the Promotion of Global Warming Countermeasures (Japanese only)" of Bureau of Environment, Tokyo Metropolitan Government
- For data submitted by each business, please see "Tokyo Cap-and-Trade Program (Japanese only)" of Bureau of Environment, Tokyo Metropolitan Government